Performance
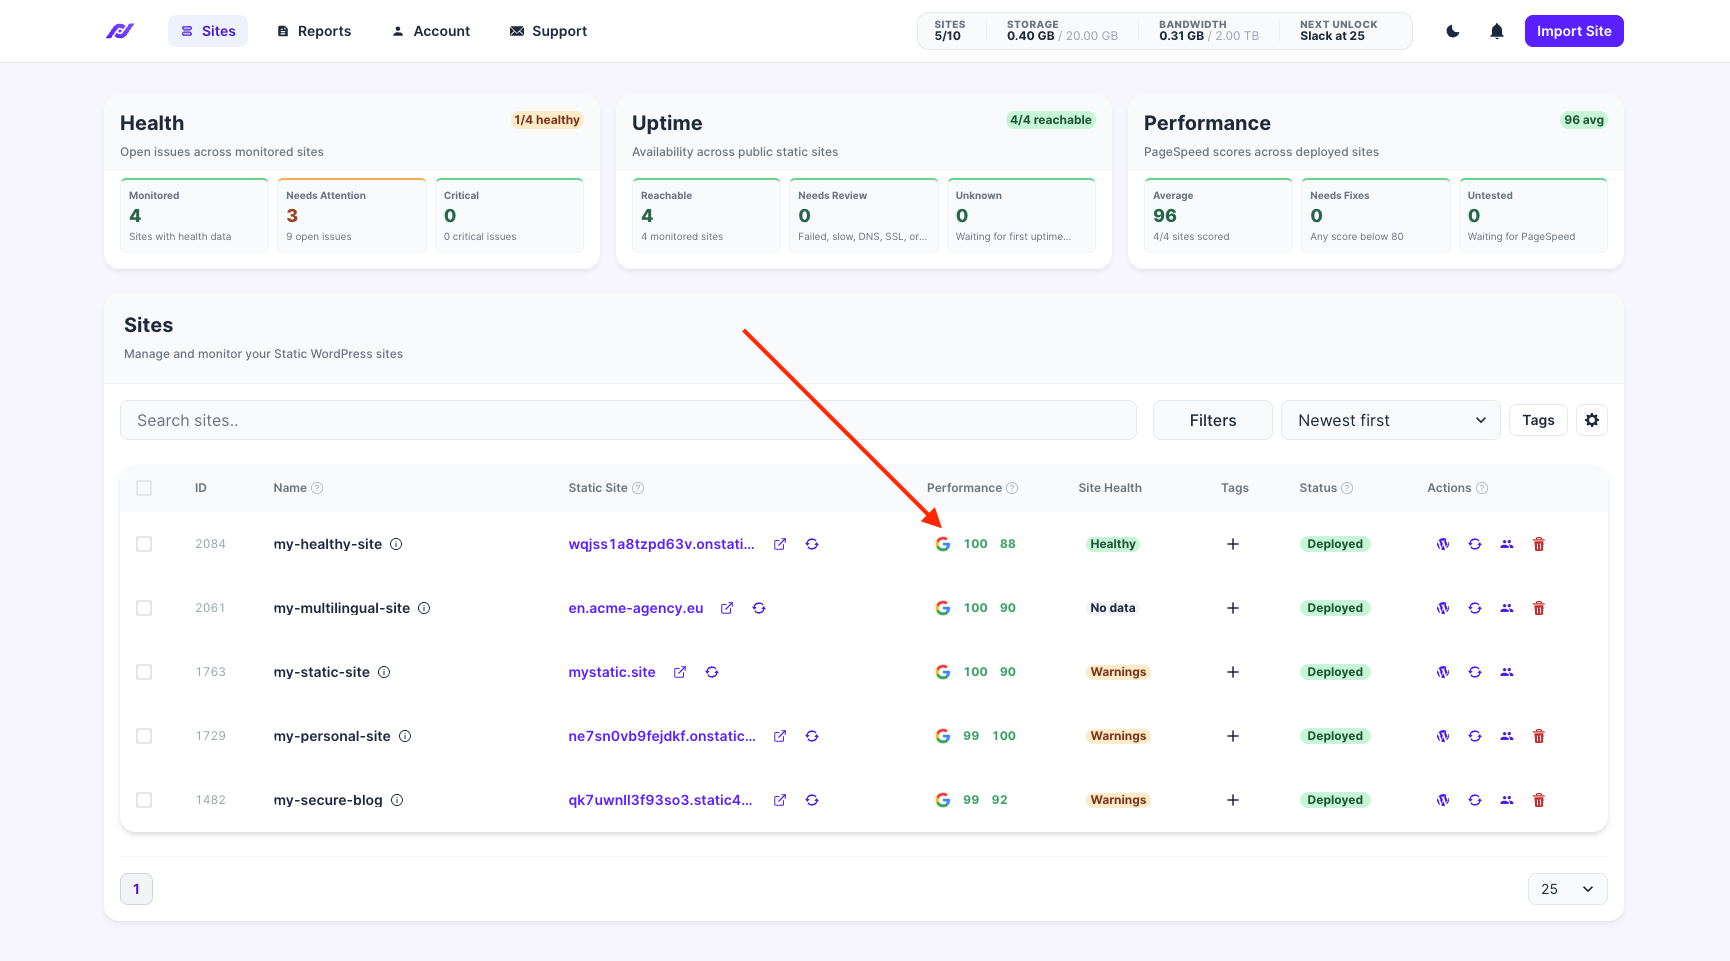
You can get detailed insights into your site's performance by clicking on the Performance column for your site:
We separated the data into three tabs - Google Page Speed Insights, TTFB, and usage.
Pagespeed Insights
This data is coming directly from Google PageSpeed Insights and is automatically refreshed every day:
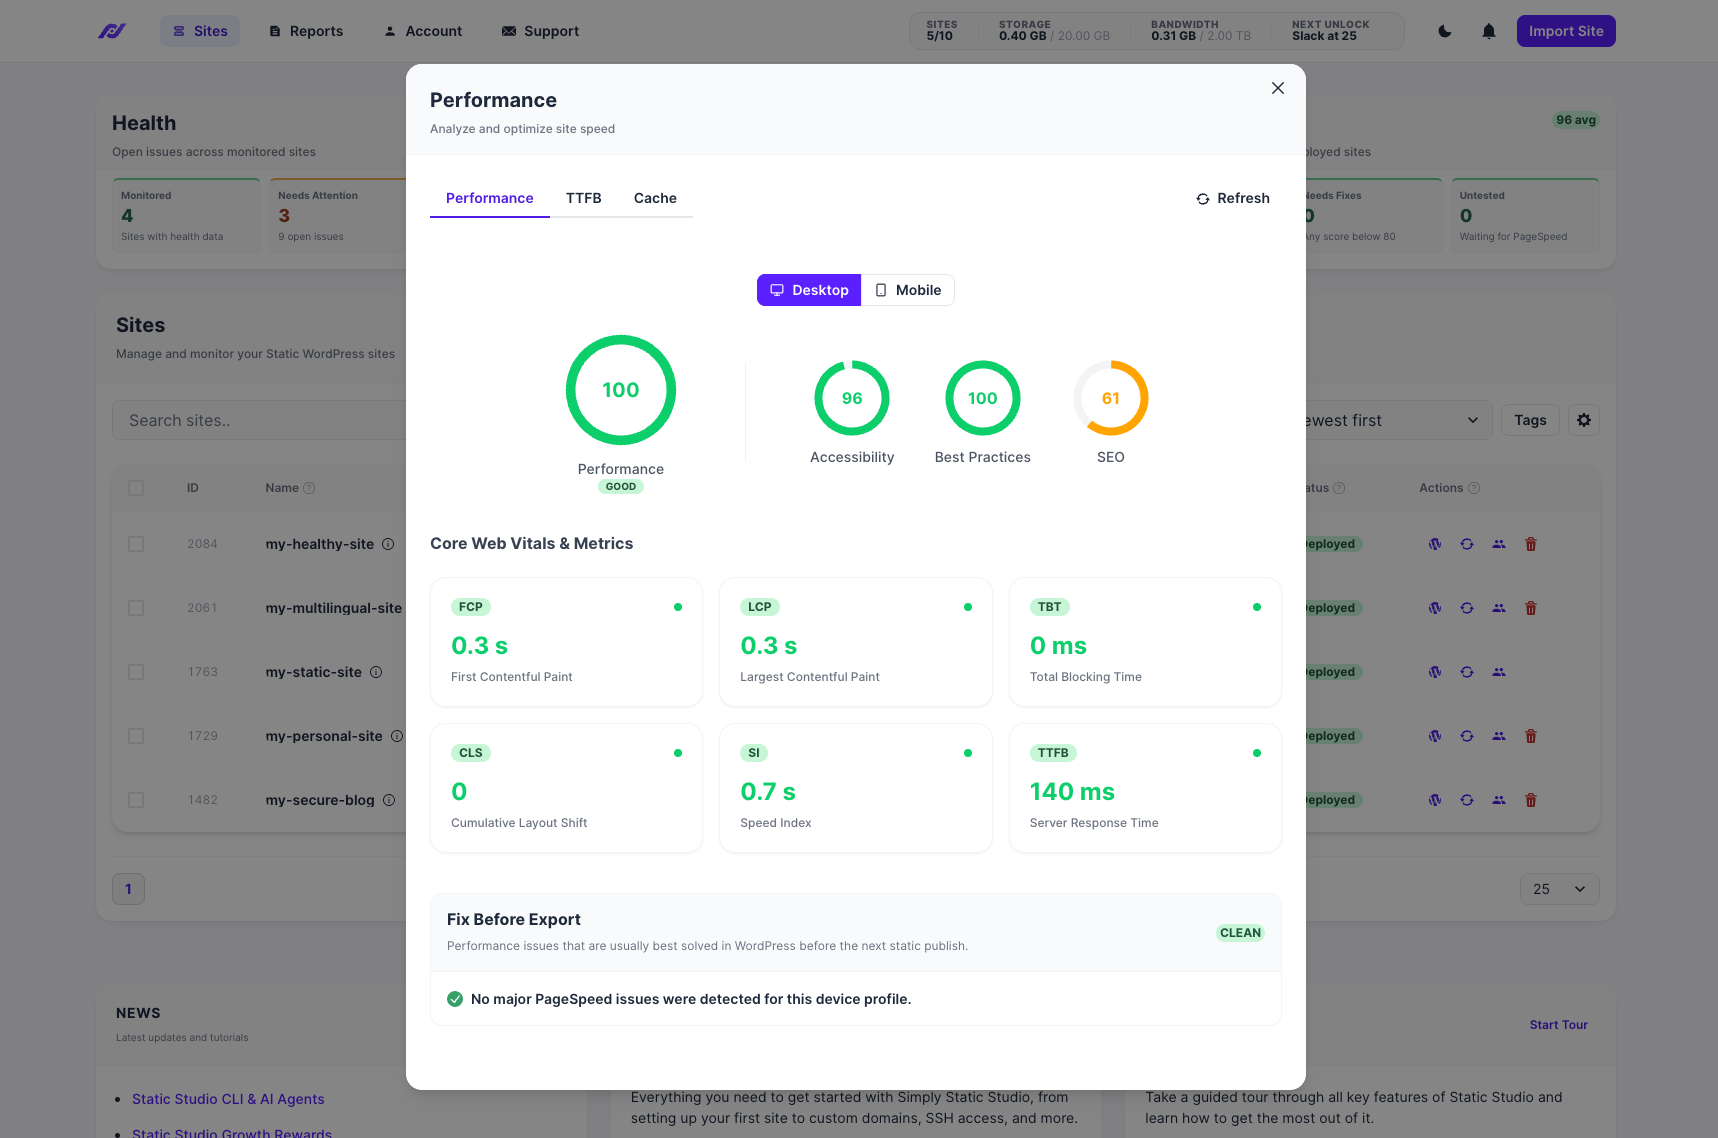
You can check the data on desktop and mobile using the toggle, or refresh it manually at any time.
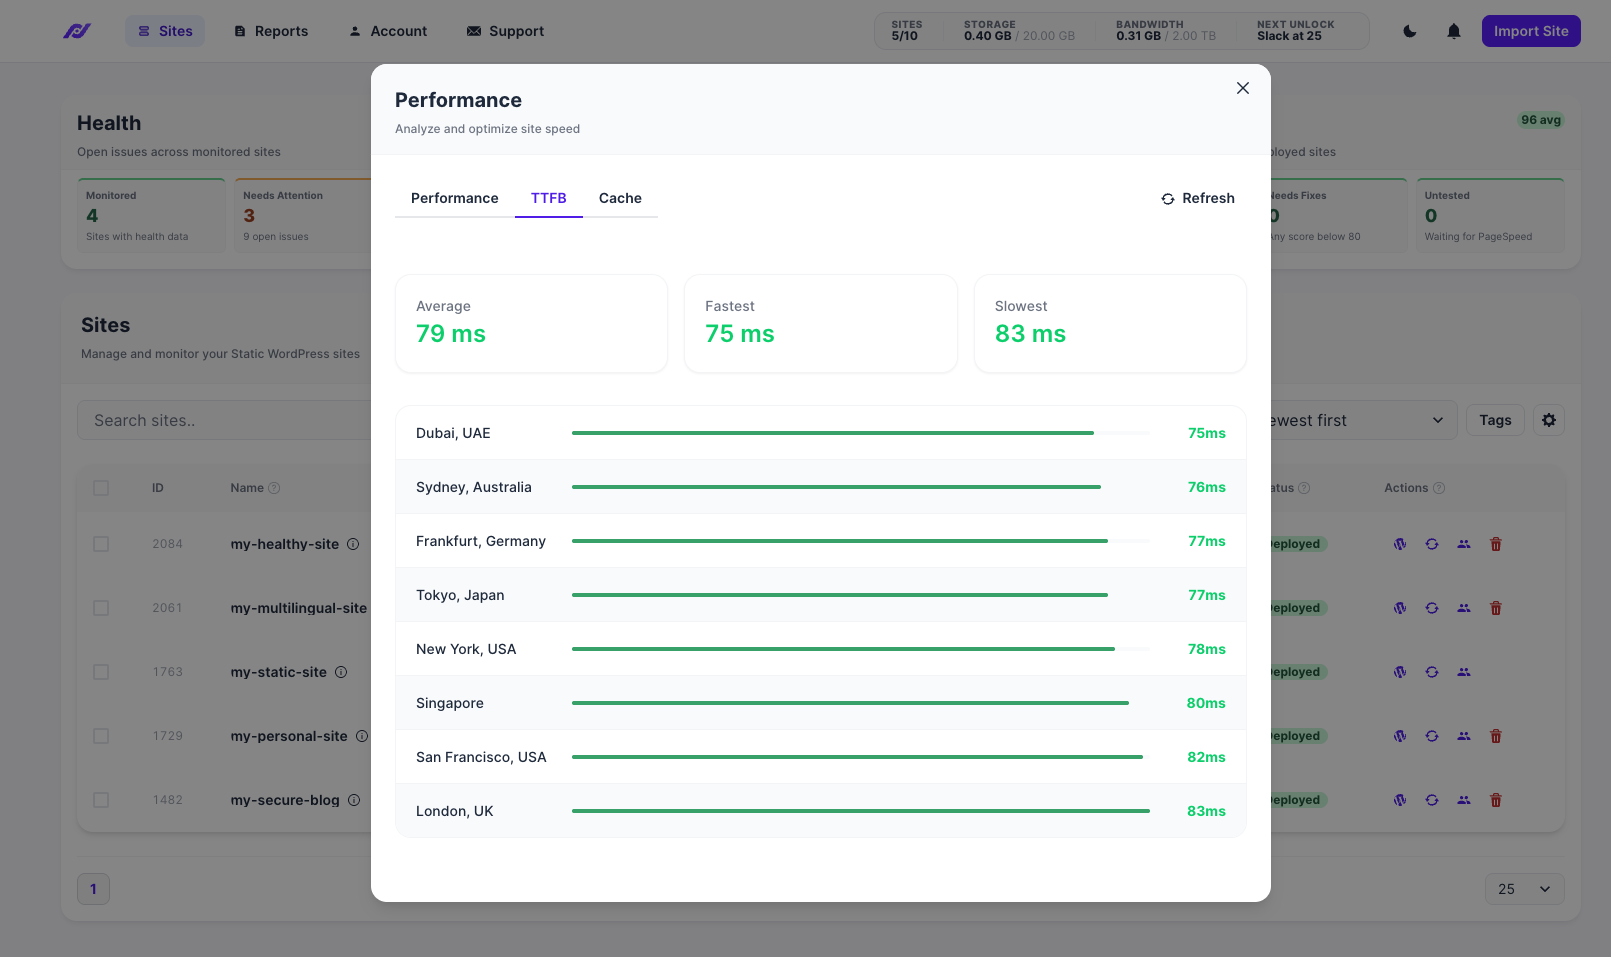
Global TTFB
Time to first byte is one of the most important metrics for your page speed - we automatically handle the distribution of your static site across the entire globe for minimal latency and best possible performance.
In the TTFB tab, you can see exactly how fast your site responds from different locations:
Cache
In the cache tab, you can see your bandwidth and storage usage as well as your cache hit rate:
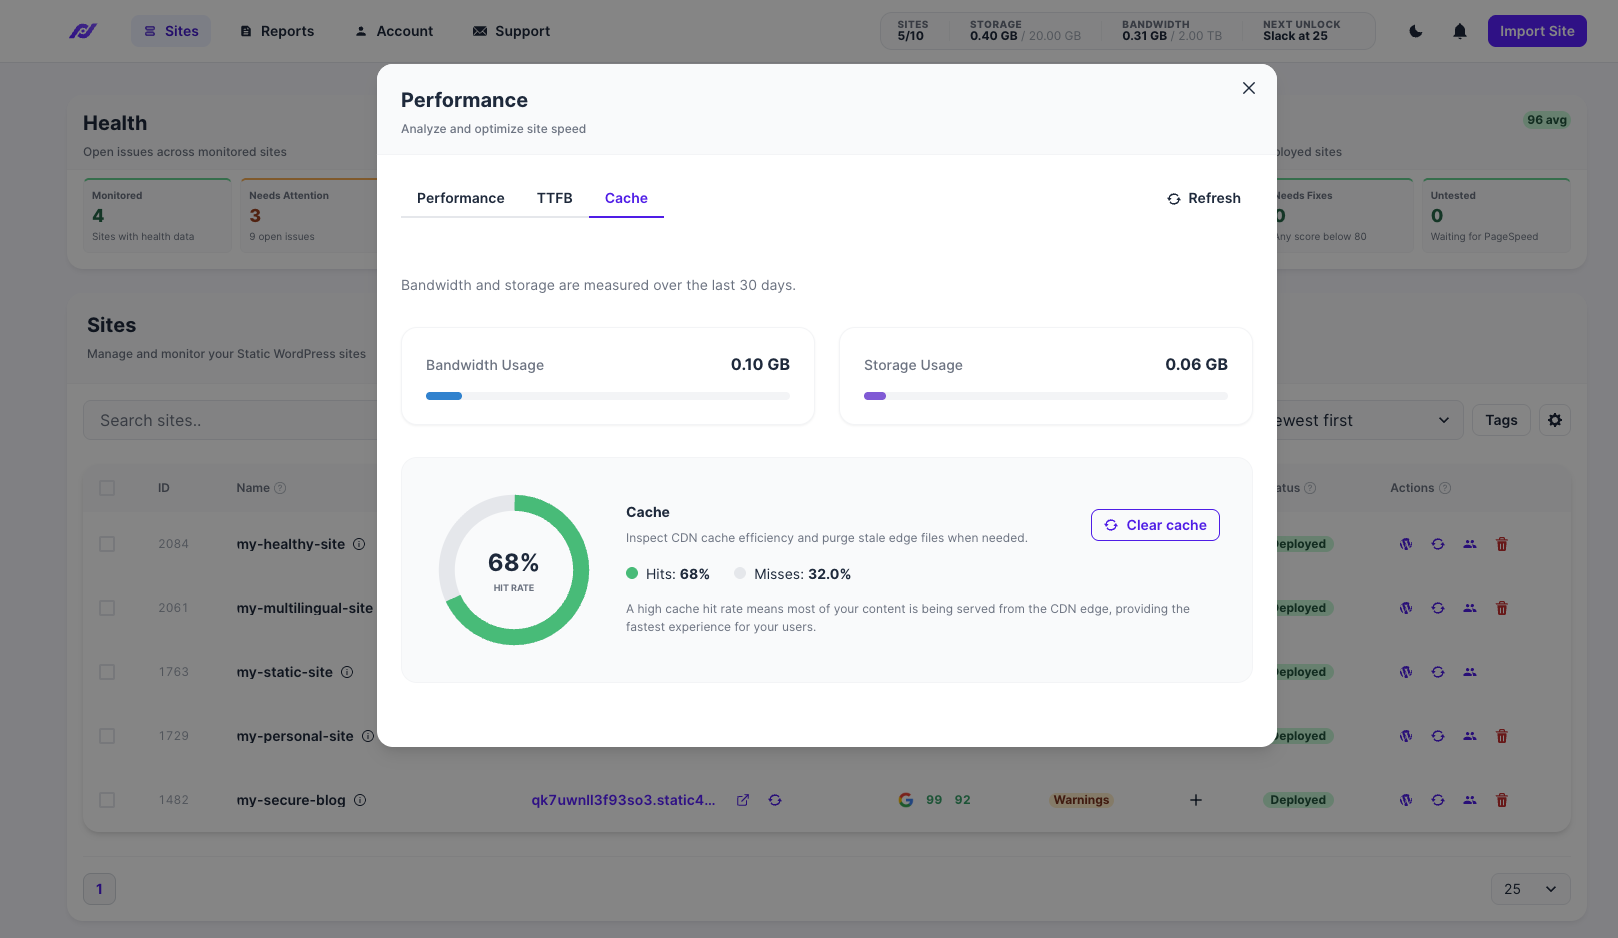
The data shown is based on the last 30 days of usage.
Bandwidth Usage:
Bandwidth in website hosting is the amount of data your website can transfer to your users in a given amount of time.
It can be tracked without violating the GDPR, unlike monitoring visitor counts. You can calculate your bandwidth usage by having a look at your monthly visitors with this formula:
Bandwidth (GB) = (Average Page Size (MB) × Monthly Visitors × Pages Viewed per Visitor) / 1024
Cache Hit Rate:
The percentage of your visitors who hit the cache (the higher, the better). Requests served by the cache are faster and reduce bandwidth consumption.
Average Response Time:
The average response time of your static website.
We calculate this based on responses from over 120 data centers worldwide, giving higher priority to those that serve the most traffic to your website.